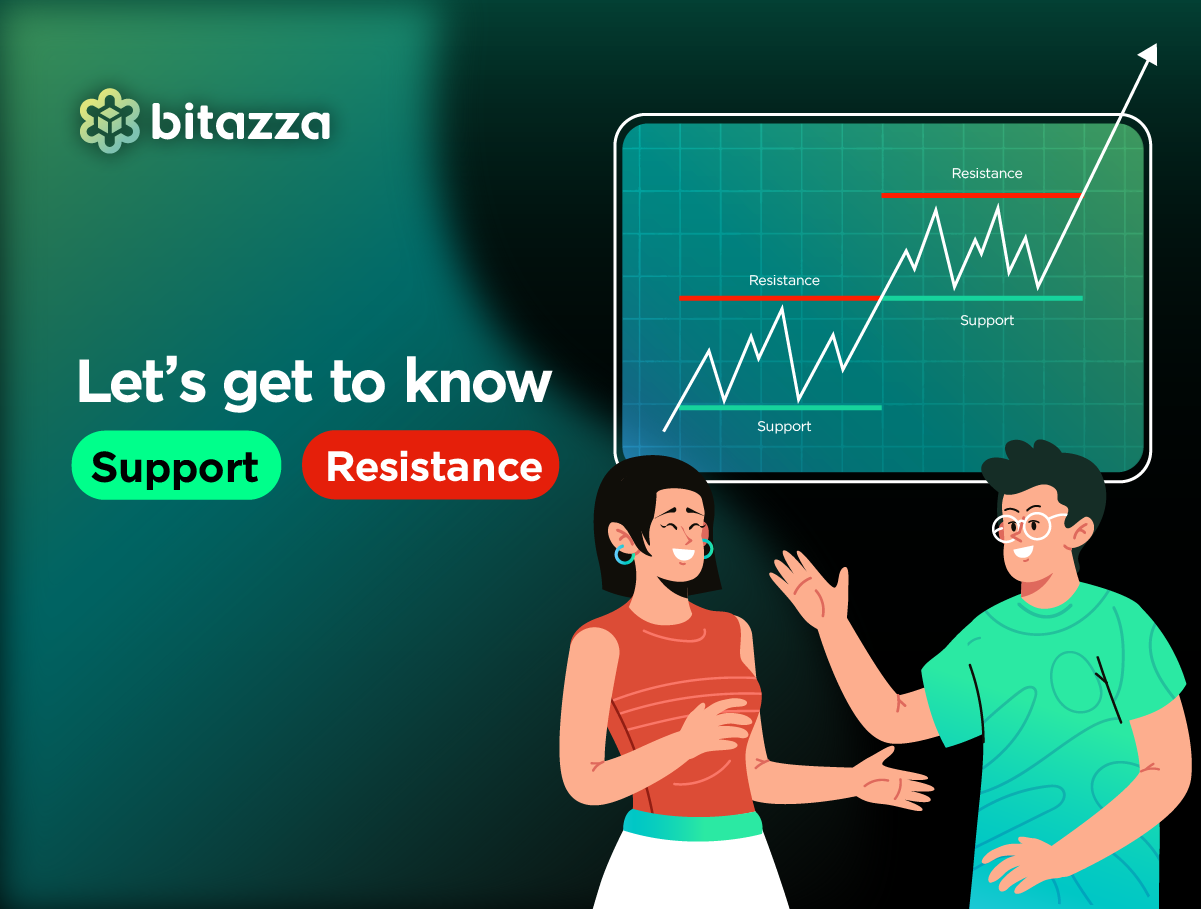
Support and Resistance are two essential concepts you need to understand to conduct Crypto Technical Analysis.
In Bitazza’s Weekly Technical Analysis, the green and red lines on the charts indicate the Support and Resistance levels that our analysts have plotted to help you analyze how prices may behave during the week and identify critical markers like price ceilings, price floors, and buy-sell walls so you can make strategic trading decisions.
*Note: Materials on Bitazza Weekly Newsletter are intended to be used for informational purposes only and do not necessarily represent those of Bitazza and do not constitute financial or investment advice
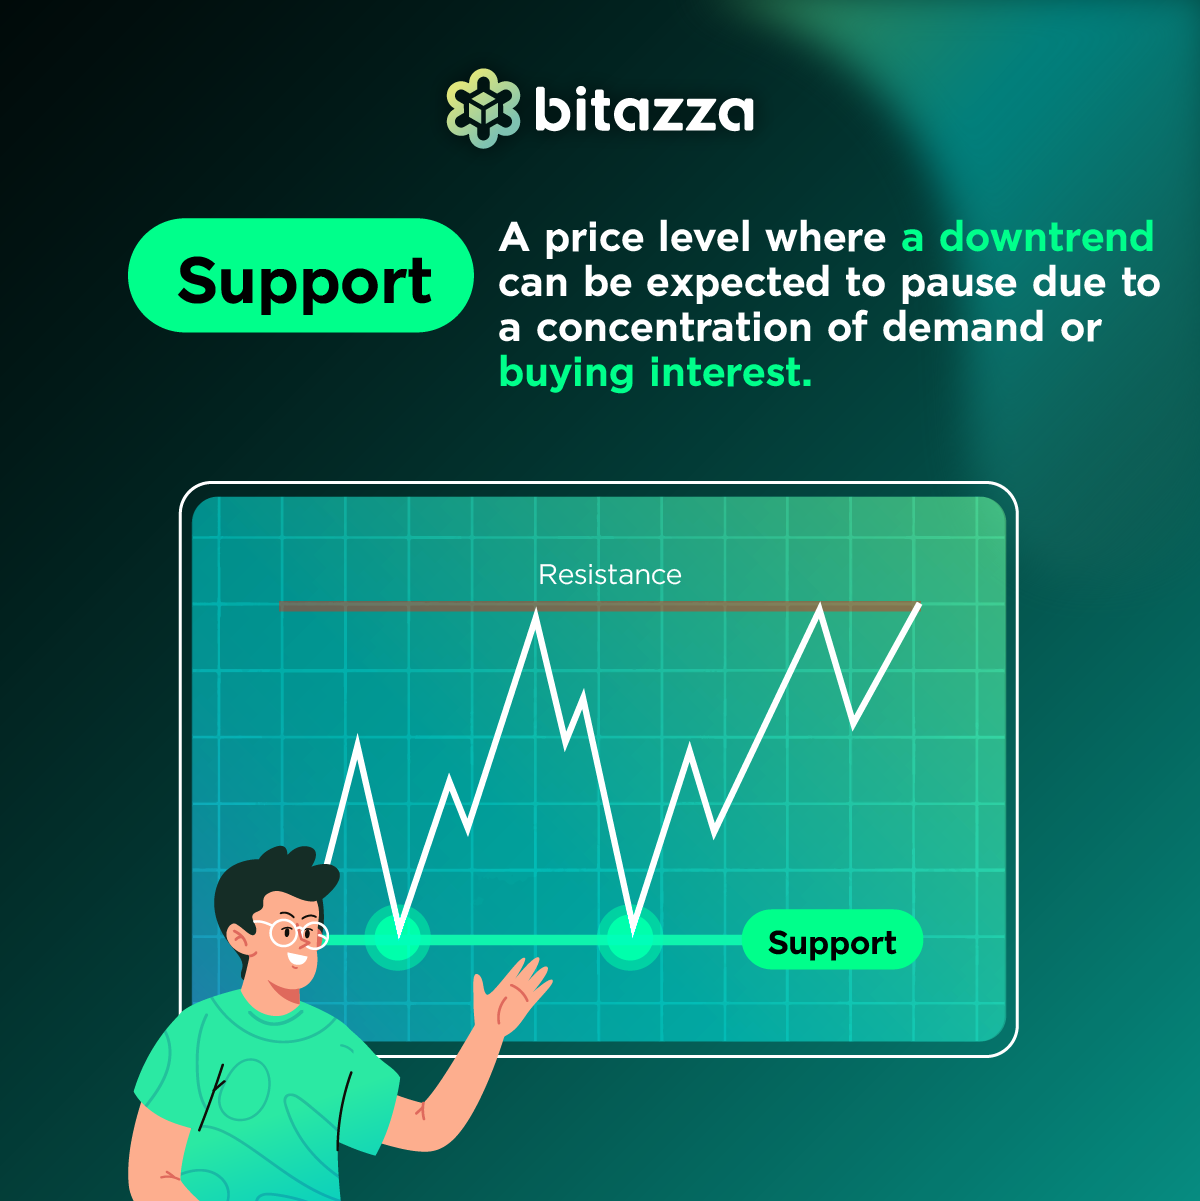
Support Level: A price zone that an asset will struggle to fall below in a given period due to increased buying interest around that pricepoint that pushes price back up. A strong Support level can prevent an asset from falling too far during a downtrend.
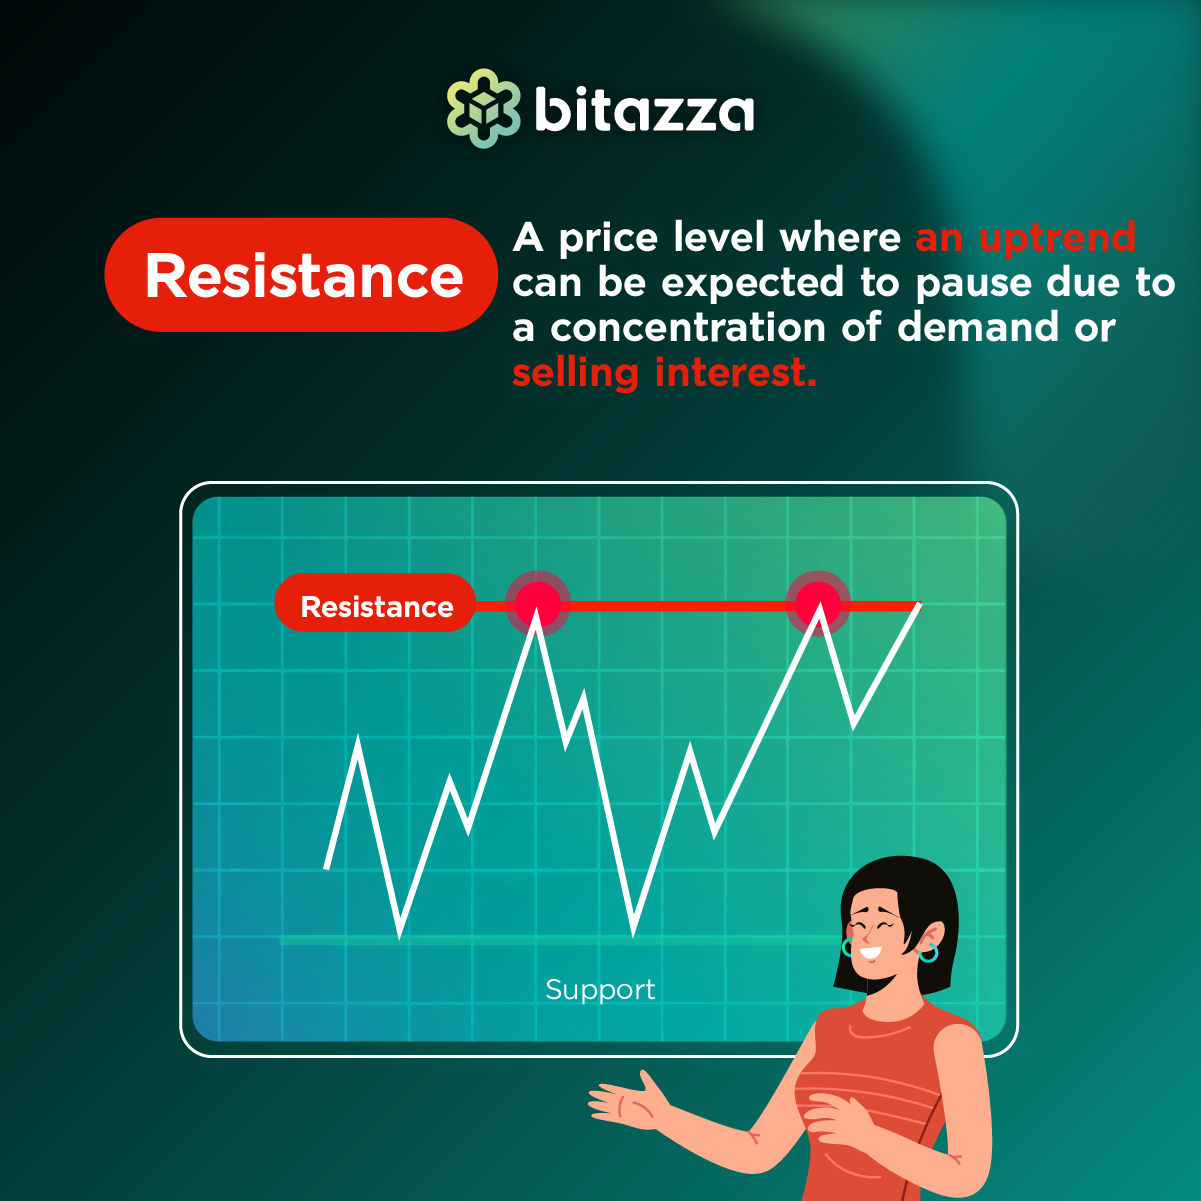
Resistance Level: A price zone that an asset will struggle to break through due to increased selling pressure from traders looking to lock in a profit that drives prices down in response. A strong Resistance level can halt an uptrend.
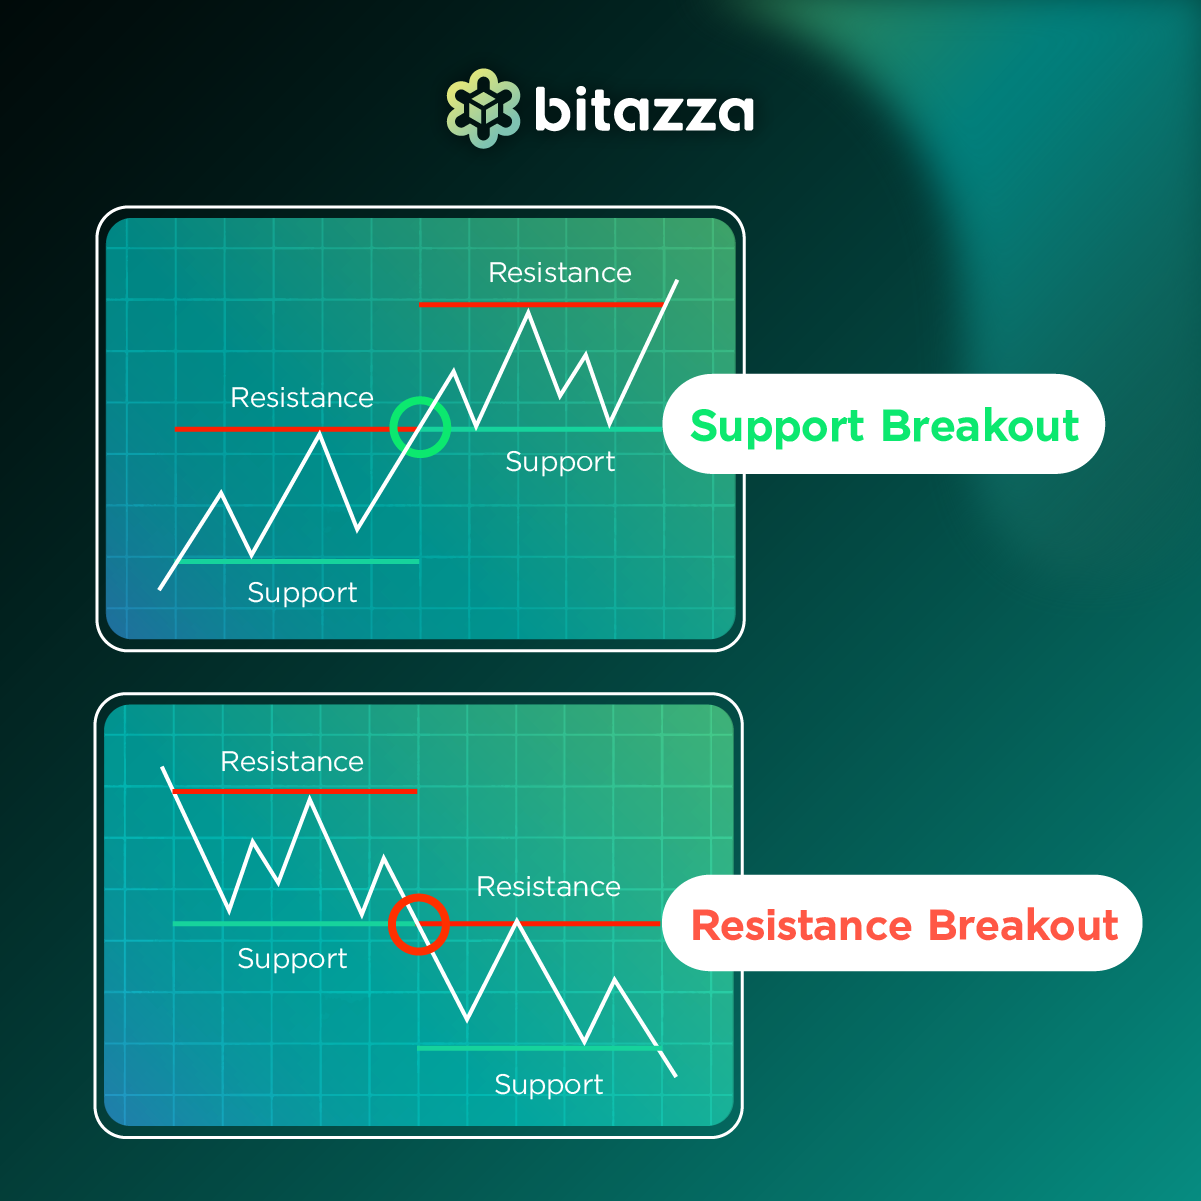
Breakout: When the price of an asset breaks through Support or Resistance. A breakout in either direction can signal trading opportunities for traders that can time entries and exits appropriately. A breakout to the upside could signal traders to go long or cover short positions. A breakout to the downside could signal traders to go short or cover long positions.
Interpreting Support and Resistance
- If prices approach Support or Resistance, it may end up bouncing off unless the asset has enough momentum to overcome the Support or Resistance.
- If the breaks out it will most likely continue in whatever direction it is trending in.
(i.e. an upside breakout will mean that the assets uptrend will continue)
How to Plot Support and Resistance Trendlines
- Identify the three (or more) highest price points during price swings. Draw a trendline that comes as close to the points you’ve identified as you can. This is your Resistance trendline.
- Identify the three (or more) lowest price points during price swings. Draw a trendline that comes as close to the points you’ve identified as you can. This is your Support trendline.
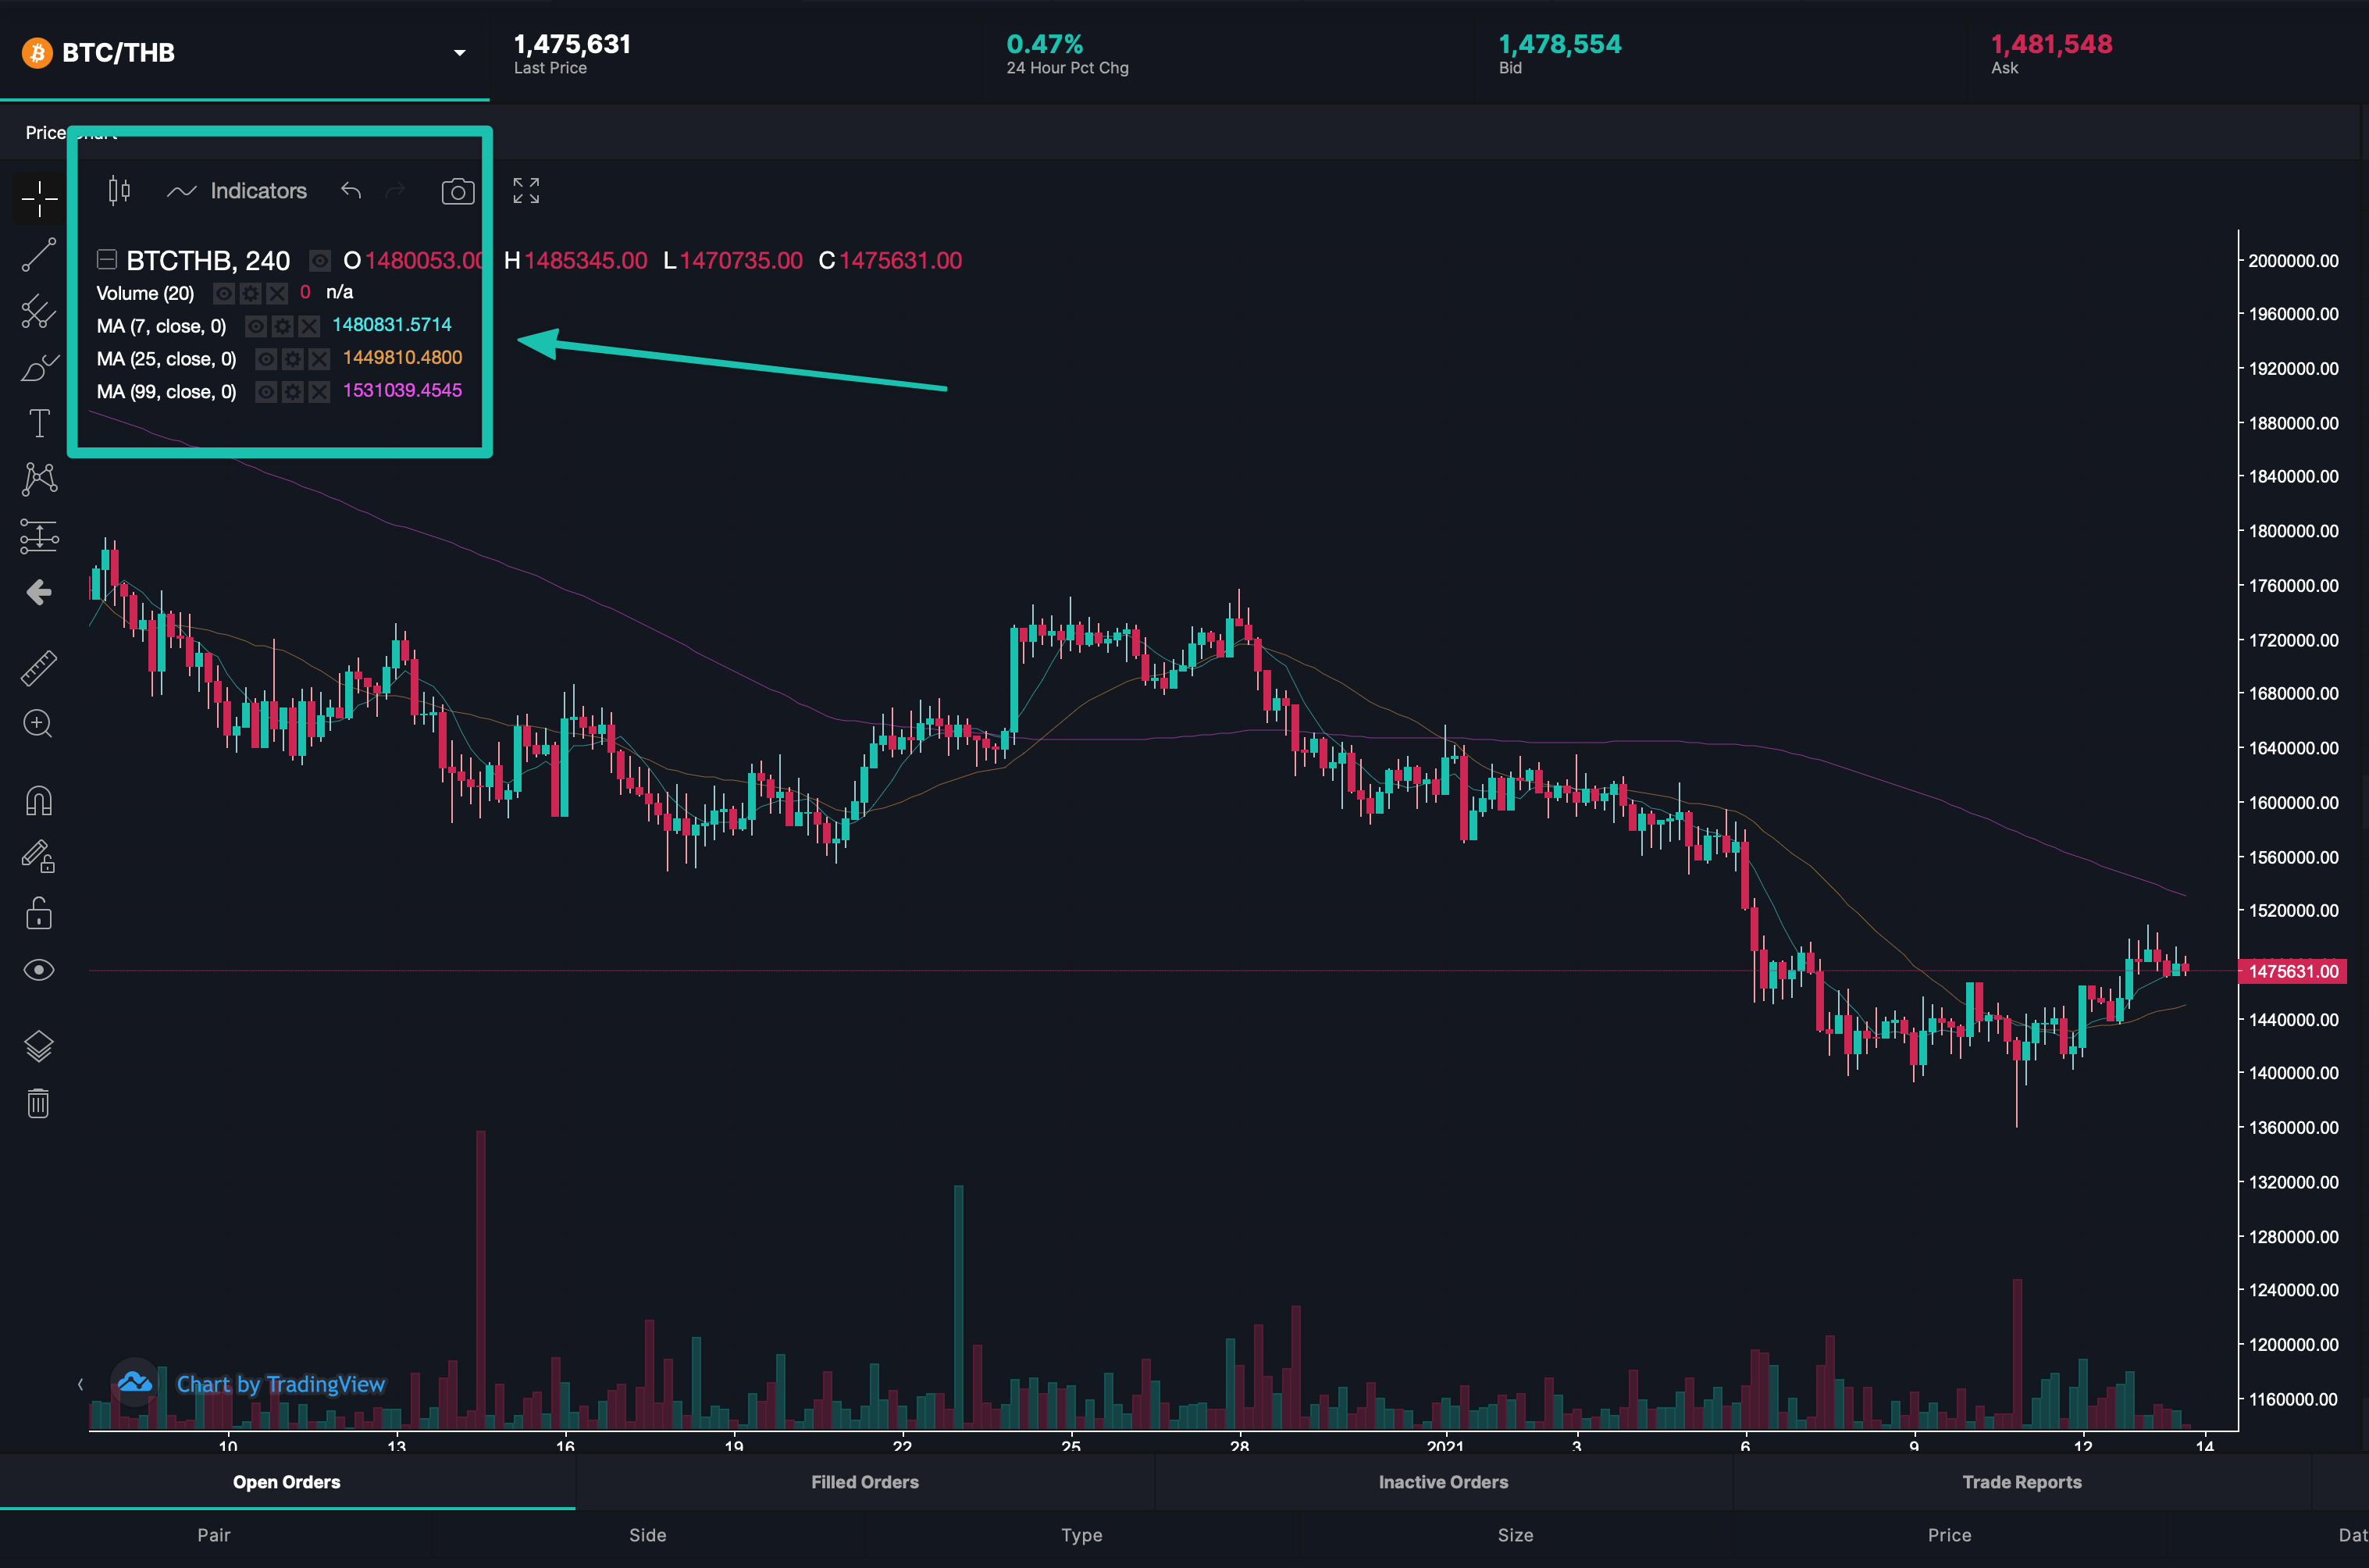
- Utilize the Moving Average (MA) indicator that’s available on the Bitazza candlestick charts. The MA line is a calculation of the average price of that asset that uses its price history over a specified period of time. Bitazza automatically sets MA at 7, 25, and 99 days.
How to Use Support and Resistance
- Identifying Support and Resistance can help you pick appropriate entry and exit points by looking at how close the price is to Support and Resistance levels at the time.
- You can use Support and Resistance trendlines to help determine whether an asset is in an uptrend, a downtrend, or trending sideways.
Materials on Bitazza Content Hub are intended to be used and must be used for informational purposes only. The views, information, or opinions expressed are solely those of the individuals involved and do not necessarily represent those of Bitazza and its employees.
The website and the information contained herein is not intended to be a source of advice or financial analysis with respect to the material presented, and the information and/or documents contained in this website do not constitute investment advice.
You might also like
More from Trading
MYRO (Myro) is open for Futures Trading (MYRO/USDT)
Myro is a meme-inspired cryptocurrency built on the Solana blockchain, named after the dog of Solana Co-Founder, Raj Gokal. It …
PORTAL (Portal) is open for Futures Trading (PORTAL/USDT)
PORTAL (Portal) is open for Futures Trading (PORTAL/USDT)! Portal's goal is to bring games and gamers from different blockchain networks together …
TON (Toncoin) is open for Futures Trading (TON/USDT)
TON (Toncoin) is open for Futures Trading (TON/USDT)! TON (Toncoin) is a decentralized blockchain developed by Telegram in 2018, and later …


