


Trading Strategies: Support and Resistance
Support and resistance is one of the most commonly used concepts in trading. Let’s take a look at the basics.
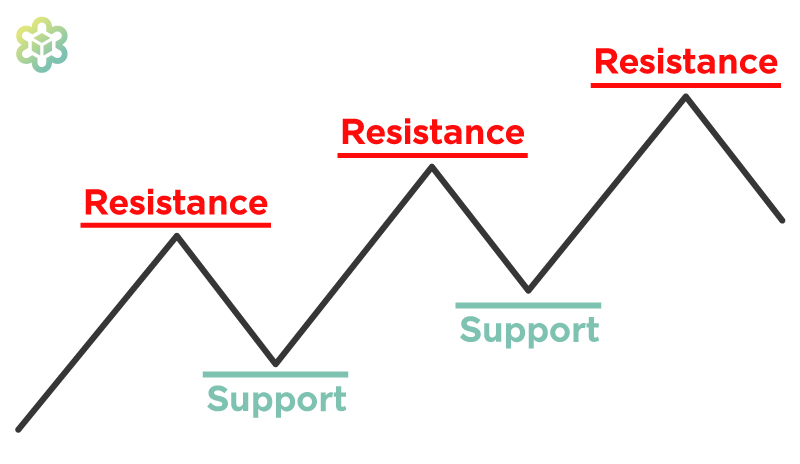
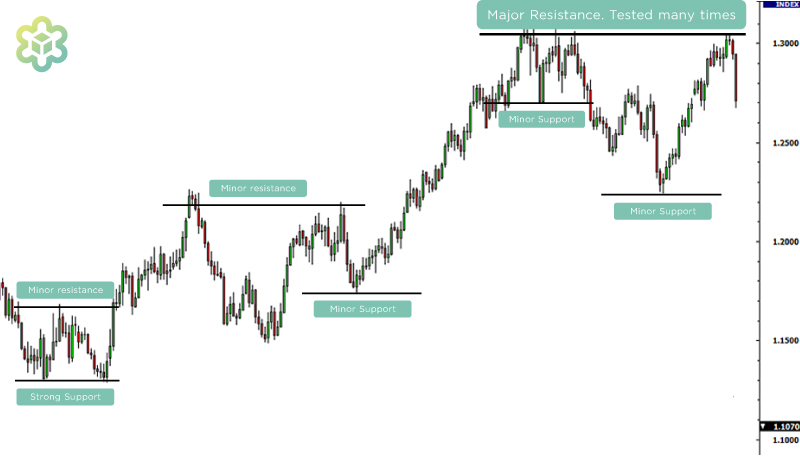
Referring to the diagram above, you will see the zigzag pattern making its way up (bull market).
When the market moves up and then pulls back, the highest point reached before the pull back is called the resistance.
And as the market continues to go up, the lowest point reached before it bounces back up is known as support.
Resistance and support are continuously formed as the market moves over time. The opposite is true for a downtrend (bear market).
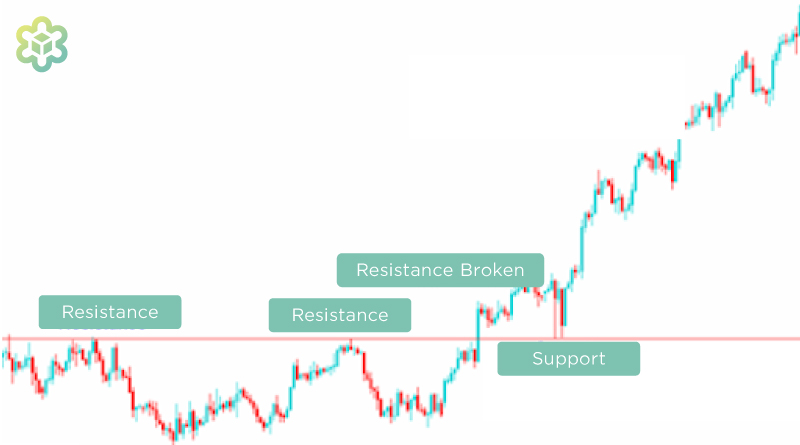
One of the concepts of support and resistance is once either of the level is broken, price will continue in that path.
Plotting Support and Resistance
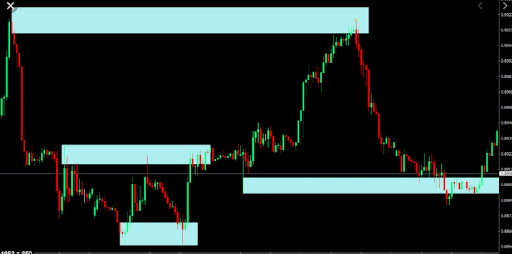
One very important thing to remember is that support and resistance levels are not an exact science. Too often you will see a support or resistance level being broken, but soon after the market reverses in the opposite direction. Which could be caused by the market simply testing those levels or a trap was in place.
Using candlestick charts as reference, these “tests” of support and resistance are often represented by the candlestick shadows.
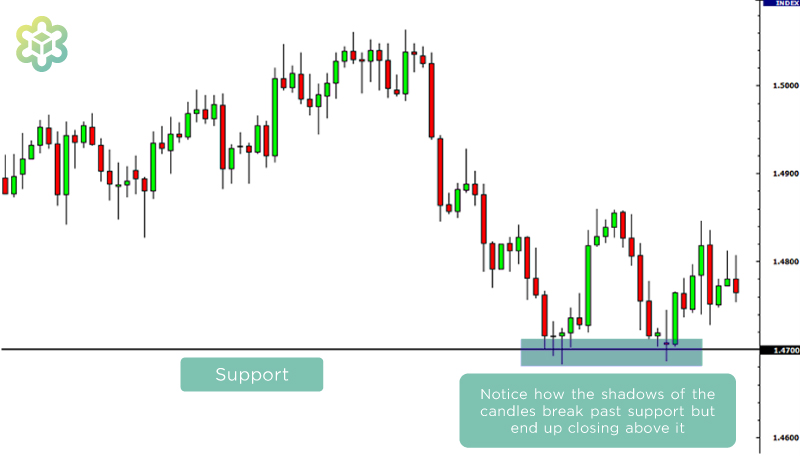
Notice how the candlesticks breaking the support failed to close below the support level. At those times it may seem like the market was “breaking” support but in hindsight, the market was merely testing that level.
So how will we know if the support or resistance level was broken? Well there is not definite answer to this question. Some may say that a support or resistance level is broken if the marketprice can close past those levels. However, if u ask any experienced trader – that is not always the case.
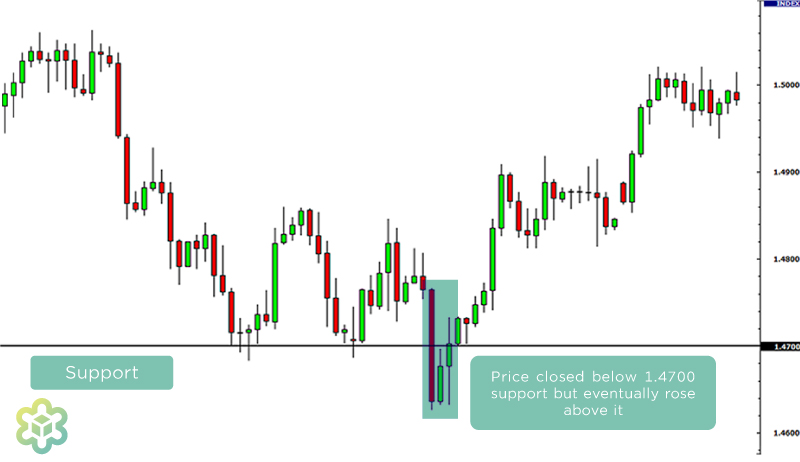
Let’s take our same example from above and see what happened when the price actually closed past the support level.
As you can see, the price closed below the support level but soon after the price climbed back up above it. If you had sold some Bitcoin then, you would have cashed out at the lowest prices.
Somethings to note about support and resistance:
- Support and resistance levels should be determined as zones more than exact levels.
- When prices breaks through resistance, that resistance could potentially become support.
- The more often price tests a support or resistance level without breaking it, the stronger the support or resistance level is.
- When a support or resistance level is broken, how strong the follow through can depends on how sturdy of the support or resistance has been holding.
With some practice, you should be able to determine potential support and resistance levels easily.
You might also like


More from Blockchain

Bitazza Token Listing Announcement: STX — Get to Know Stacks
We’re excited to announce that Stacks (STX) is now listed on Bitazza! You can now buy, sell, and trade Stacks along …

Getting Started with DeFi Protocols
What is DeFi Protocol? A DeFi Protocol, or Decentralized Finance Protocol, is a system within the decentralized finance (DeFi) space that …

What was the excitement after the approval of the Bitcoin ETF?
Many new investors may still be wondering whether the approval of the Bitcoin ETF by the U.S. SEC is a …