Getting To Know: Fibonacci Retracement
What is Fibonacci Retracement? Fibonacci retracement is a technical analysis method for determining support and resistance levels after prices have been trending in one direction. The theory is that once prices have started making a big move in one direction (either up or down), prices will have to retrace before continuing in the same direction. Traders will use the Fibonacci Retracement method (combined with other indicators) to look for support or resistance levels to time their trade entry.
The first thing to know is that Fibonacci tools work best when the market is trending. So the idea is to buy at support levels when the market retraces after trending upwards. And selling at resistance levels if the market is trending downwards. The idea is when prices start trending in a certain direction, prices will have to retrace before continuing in the same direction.
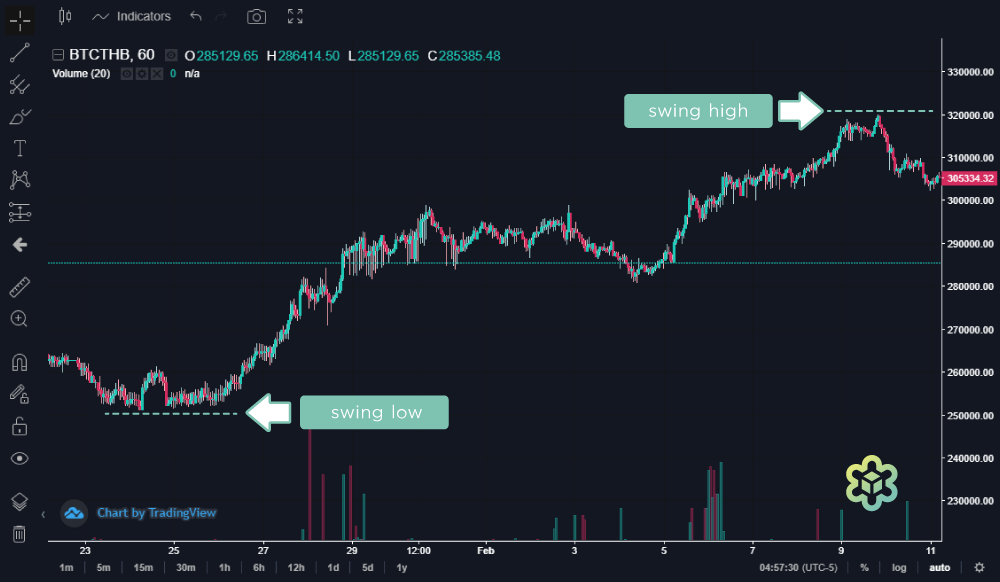
In order to apply Fibonacci levels to your charts, you’ll need to identify Swing High and Swing Low points. A Swing High is a candlestick with at least two lower highs on both the left and right of itself. A Swing Low is a candlestick with at least two higher lows on both the left and right of itself.
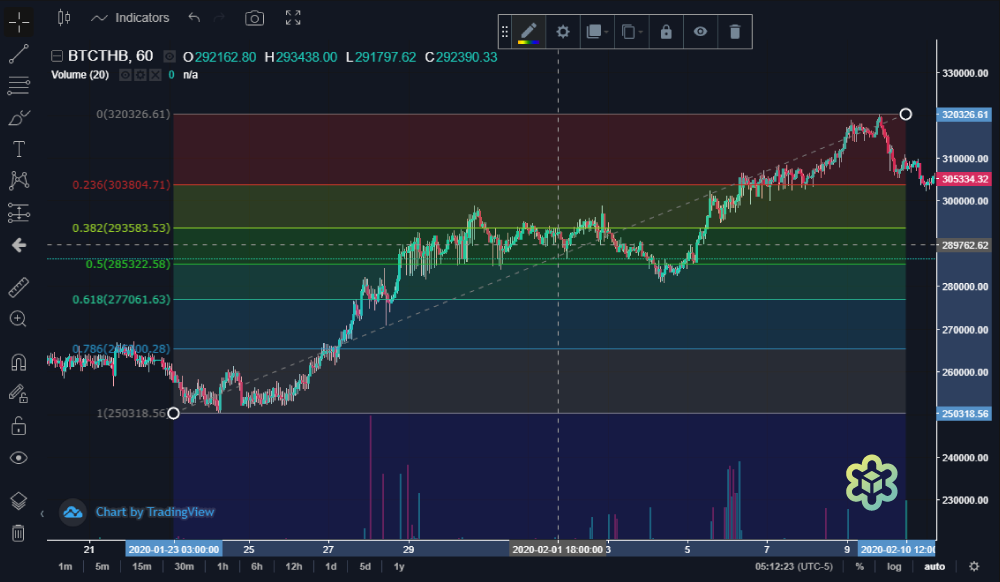
Start by clicking on the swing low and clicking on swing high levels when price is trending upwards (image below). The opposite is true when prices trend downwards.
As you can see, the Fibonacci Retracements levels are 303,804.71 THB (0.236), 293,583.53 (0.382), 285,322.58 (0.5), 277,061.63 (0.618) and 265,300.28 (0.786).
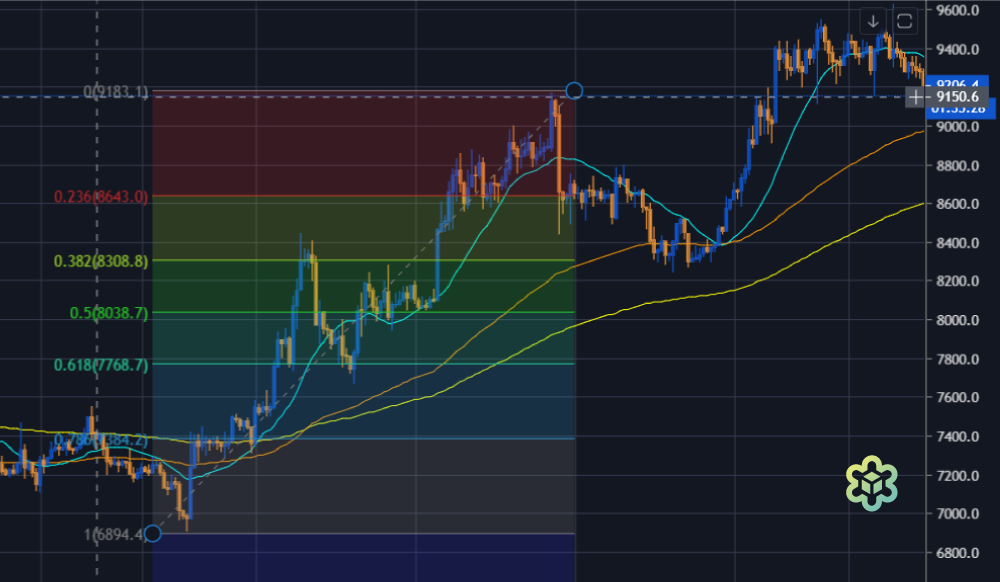
Because so many traders are looking at these levels, these levels sometimes become self fulfilling prophecies. In the example of the below image, you will see price retracing and bouncing off the 0.382 level before continuing its upward trend.
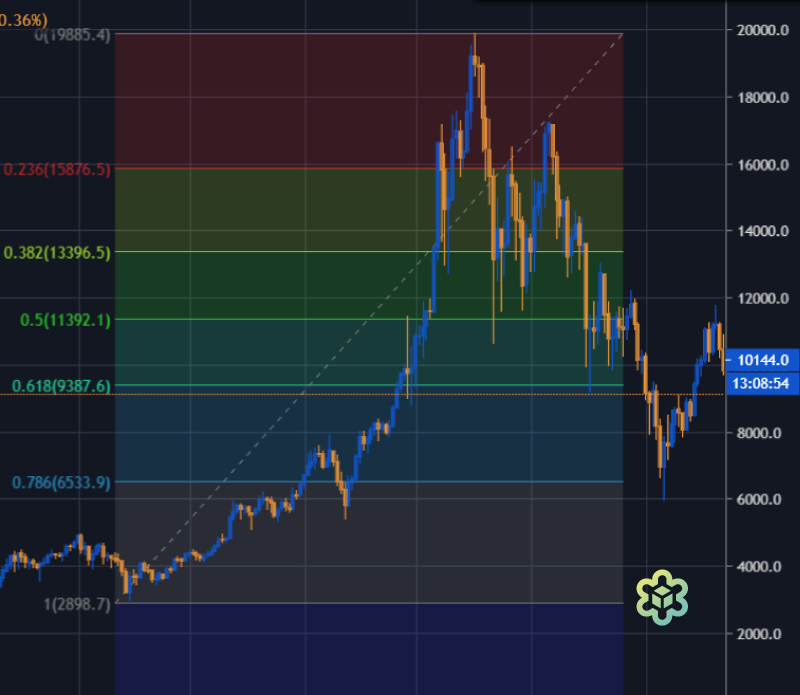
I shouldn’t have to say this.. But please note that – Fibonacci support and resistance levels are not 100% guaranteed to hold. Too often prices will bounce off the support or resistance levels, lose its momentum and continue in the opposite direction. The next image below shows the Fibonacci retracement levels broken at 0.5 and 0.618 before eventually finding some relief at the 0.786.
Whether or not prices will continue trending upwards we are not sure. Like all indicators, it should not be used alone. If you will notice in the sample chart before this (chart#4), price bounced off 0.318 while also being held up by another indicator. Some of the popular strategies that traders use along with Fibonnaci Retracement levels are Support and Resistance, Trendlines, Moving Averages, Relative Strength Index (RSI), Stochastic, MACD and many others.
But whatever indicators you use and how well you use them, you will find yourself in a losing position some day. In the end, just be sure that you have a disciplined stop loss. Good luck!
You might also like
More from Blockchain
Bitazza Token Listing Announcement: STX — Get to Know Stacks
We’re excited to announce that Stacks (STX) is now listed on Bitazza! You can now buy, sell, and trade Stacks along …
Getting Started with DeFi Protocols
What is DeFi Protocol? A DeFi Protocol, or Decentralized Finance Protocol, is a system within the decentralized finance (DeFi) space that …
What was the excitement after the approval of the Bitcoin ETF?
Many new investors may still be wondering whether the approval of the Bitcoin ETF by the U.S. SEC is a …


